45 Australian Gym Market Statistics and Growth Trends (2026 Report)
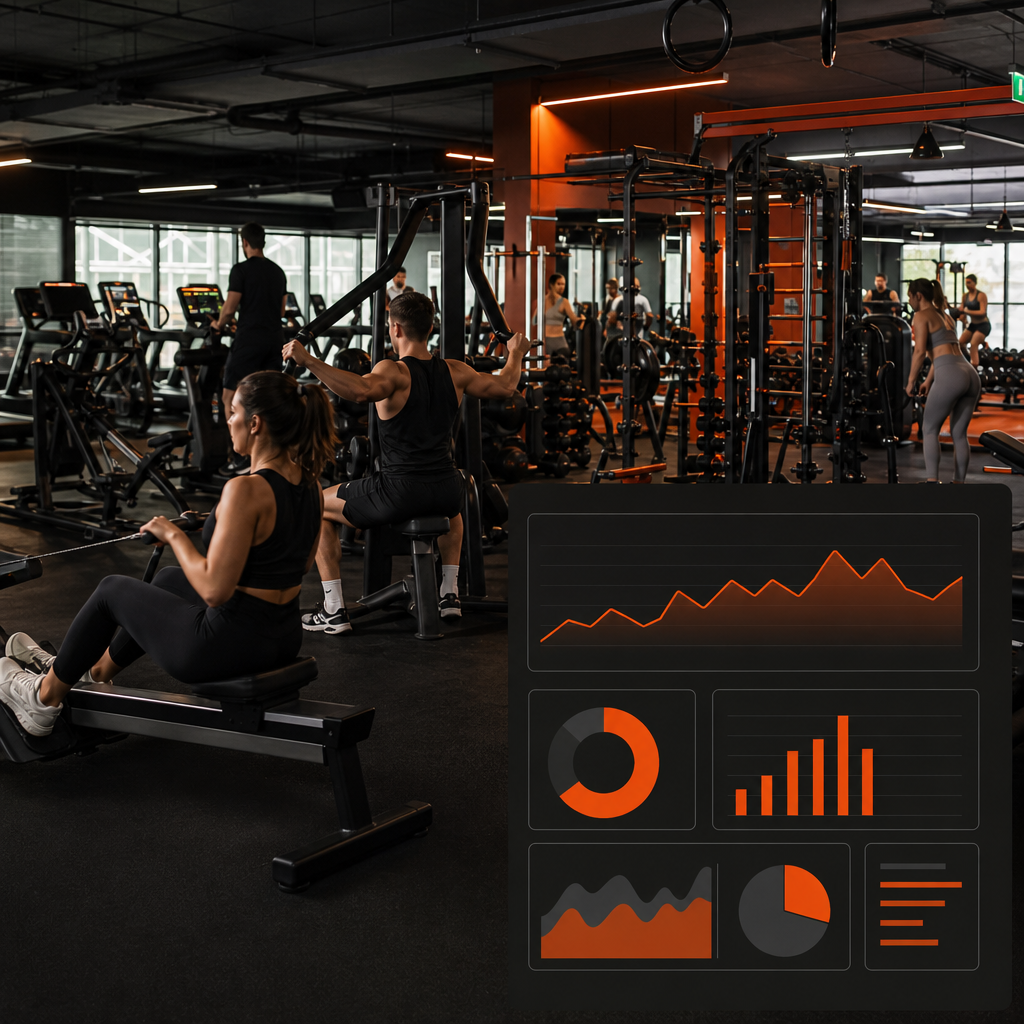
Key Statistics Summary
- According to IBISWorld's Australian Gyms and Fitness Centres industry research (IBISWorld), industry revenue has reached approximately $3.5 billion.
- According to Deloitte Access Economics research commissioned by the Australian fitness industry (AUSactive), fitness activity produces an estimated $8.5 billion in annual economic benefits for Australia.
- According to Roy Morgan (https://www.roymorgan.com/), approximately 4.82 million Australians held a gym membership in its 2018 reporting, equal to 28.2% of the population aged 14 and over.
- According to the Australian Bureau of Statistics (ABS), only 22.4% of Australians aged 18-64 met both the physical activity and muscle-strengthening guidelines in 2022.
- According to the World Health Organization (WHO), 31% of adults worldwide did not achieve recommended physical activity levels in 2022.
- According to the American College of Sports Medicine's 2025 worldwide fitness trends survey (ACSM), wearable technology was the highest-ranked fitness trend, followed by mobile exercise apps.
- According to the ClassPass 2024 Look Back Report (ClassPass), global Pilates reservations increased by 84% during the year.
- According to HoldIT's consumer intent data, Australian search interest for innovative gym gear increased by 22% over the measurement period used for this report. This is proprietary directional data rather than a whole-of-market estimate.
Introduction
Australia's gym market entered the 2020s under unusual conditions. Lockdowns disrupted facility attendance, encouraged home exercise and accelerated the adoption of workout apps, connected equipment and hybrid memberships. Once restrictions eased, gyms had to serve consumers who still valued physical facilities but expected greater flexibility, stronger digital support and more control over how they trained.
This 2026 report brings together 45 Australian gym market statistics and related international benchmarks from government agencies, industry researchers, participation surveys and fitness platforms. It is intended for gym operators, equipment suppliers, investors, researchers, journalists and practitioners analysing gym industry growth in Australia. The report distinguishes between Australian market figures, global context and proprietary consumer-intent signals so that unlike measures are not treated as directly comparable.
The 2026 label identifies the edition of this reference article. It does not mean every underlying survey was conducted in 2026. Government health surveys, industry reports and consumer studies are released on different schedules, so the source year is stated wherever it affects interpretation.
Key Takeaways
- Australia's gym market is a multibillion-dollar industry, but revenue alone understates its wider economic significance. Research commissioned by the fitness sector places the annual value of health and productivity benefits above direct industry revenue.
- Membership demand is broad rather than confined to athletes. Historical Roy Morgan data found that more than one-quarter of Australians aged 14 and over held gym memberships.
- The unmet health need remains substantial. ABS data show that fewer than one-quarter of working-age adults met both aerobic and muscle-strengthening recommendations in 2022.
- Gym membership trends increasingly include strength training, Pilates, recovery services, wearable devices and app-supported exercise. Operators should therefore measure more than visits to traditional cardio and weights areas.
- Equipment decisions should account for convenience between sets, storage, mobile access and data tracking, not only the performance specifications of large machines.
- Global benchmarks can indicate the direction of consumer behaviour, but they should not be presented as Australian market shares without local evidence.
- Proprietary search data can provide a useful early demand signal. It should be validated against sales, memberships and independent search datasets before being treated as a market forecast.
Summary Table: 10 Headline Market Statistics
| Market indicator | Reported figure | Geography and period | Source |
|---|---|---|---|
| Gym and fitness centre industry revenue | Approximately $3.5 billion | Australia, current IBISWorld industry analysis cited for this report | IBISWorld |
| Annual economic benefit associated with fitness | $8.5 billion | Australia, Deloitte Access Economics industry research | AUSactive |
| Australians with gym memberships | 4.82 million | Australia, 2018 | Roy Morgan |
| Population aged 14 and over with gym memberships | 28.2% | Australia, 2018 | Roy Morgan |
| Adults meeting both activity and strength guidelines | 22.4% | Australia, ages 18-64 in 2022 | ABS |
| Adults classified as overweight or obese | 65.8% | Australia, 2022 | ABS |
| Adults insufficiently active | 31% | Global, 2022 | WHO |
| Adults insufficiently active by 2030 if trends continue | 35% | Global WHO projection | WHO |
| Global health club memberships | Approximately 184 million | Global industry benchmark | Health & Fitness Association |
| Growth in Pilates reservations | 84% | Global ClassPass platform data, 2024 | ClassPass |
The figures in this table use different populations, periods and research methods. They are summary indicators, not components of a single market model.
Revenue Benchmarks and Economic Contribution
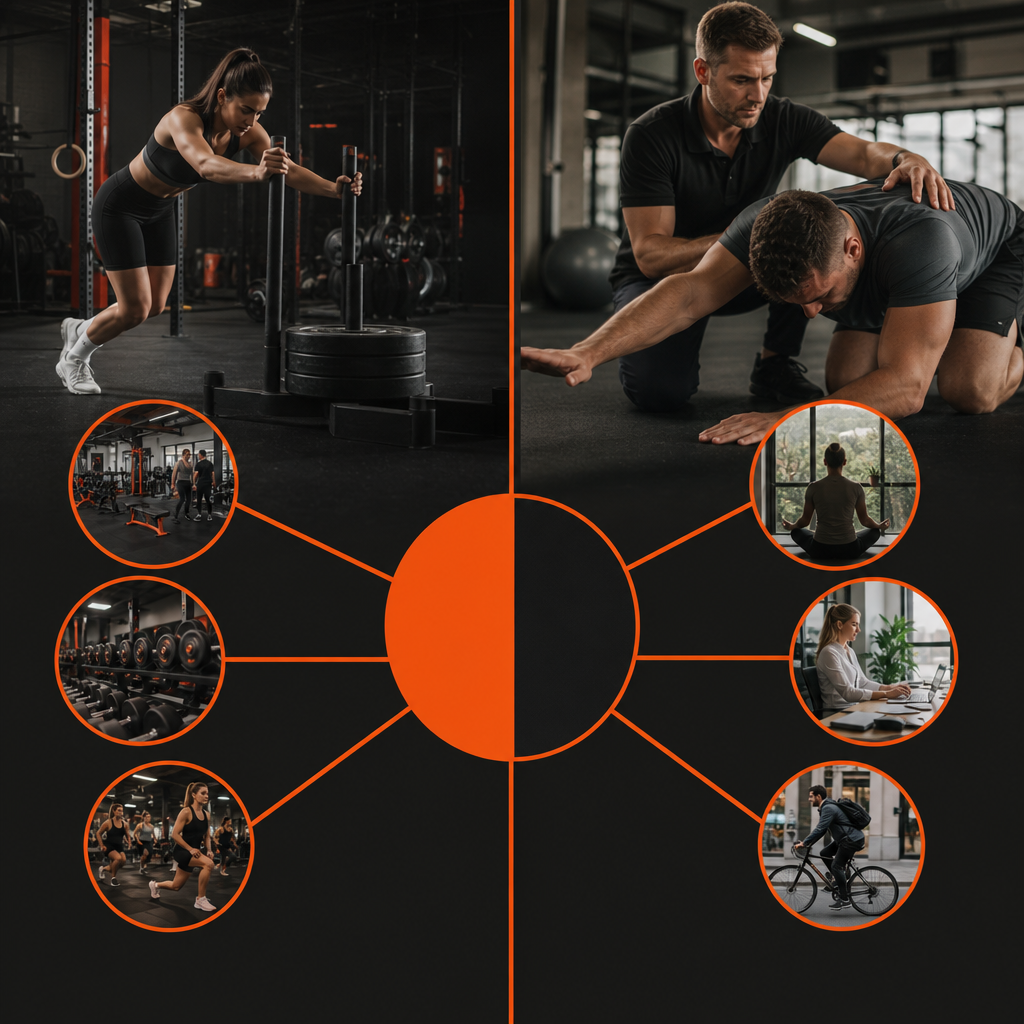
Direct revenue measures what consumers and businesses pay to gyms and fitness centres. Economic contribution studies use a broader frame that may include healthcare savings, workplace productivity and the value associated with improved health. These measures answer different questions and should not be added together.
-
Australian industry revenue: According to IBISWorld's Gyms and Fitness Centres in Australia research (IBISWorld), the industry's annual revenue has reached approximately $3.5 billion. The precise estimate can change as IBISWorld updates its industry model.
-
Wider Australian economic benefit: According to Deloitte Access Economics research made available through the Australian fitness industry's peak body (AUSactive), participation supported by the fitness sector produces an estimated $8.5 billion in economic benefits each year through health and productivity effects.
-
Benefit from activating an inactive person: According to the same Deloitte Access Economics analysis cited by AUSactive (https://ausactive.org.au/), moving one inactive Australian into regular activity was associated with an estimated annual economic benefit of approximately $2,900. This is a modelled social and economic value, not gym revenue per member.
-
Global healthcare cost of inactivity: According to Ding and colleagues in the real Lancet study, "The economic burden of physical inactivity: a global analysis of major non-communicable diseases" (The Lancet), physical inactivity cost health systems an estimated $53.8 billion internationally in 2013, expressed in international dollars in the study.
-
Global productivity losses: According to the same Lancet analysis (https://doi.org/10.1016/S0140-6736(16)30383-X), deaths attributable to physical inactivity generated an estimated $13.7 billion in productivity losses.
-
Health burden measured in lost healthy life: According to Ding and colleagues (The Lancet), physical inactivity was responsible for an estimated 13.4 million disability-adjusted life years in the study's global model.
-
Global health club revenue: According to the Health & Fitness Association's global industry reporting (Health & Fitness Association), health clubs generated approximately $94 billion in annual global revenue in the reporting period used by the association. This international figure should not be converted into an Australian benchmark without adjusting for currency, market structure and membership pricing.
-
Global health club membership base: According to the Health & Fitness Association (https://www.healthandfitness.org/), the global health club industry served approximately 184 million members.
-
Global facility base: According to the same Health & Fitness Association reporting (https://www.healthandfitness.org/), the international industry comprised close to 200,000 health and fitness facilities.
Case Study: IBISWorld Fitness Report Analysis
The approximately $3.5 billion IBISWorld revenue estimate establishes a useful scale for the Australian gym market, but it should not be read as a complete measure of Australian fitness spending. The industry classification focuses on gyms and fitness centres. Spending on home equipment, sporting clubs, physiotherapy, fitness apps, clothing, supplements and unrelated recreation categories may sit elsewhere.
The relationship between the $3.5 billion revenue estimate and the $8.5 billion economic-benefit estimate is also important. The latter is not an alternative sales estimate. It represents modelled benefits that may include avoided healthcare expenditure and improved productivity. For investment or business planning, use industry revenue to evaluate commercial scale and the economic-benefit estimate to understand the broader public policy case for activity.
Consumer Behaviour and Gym Membership Trends
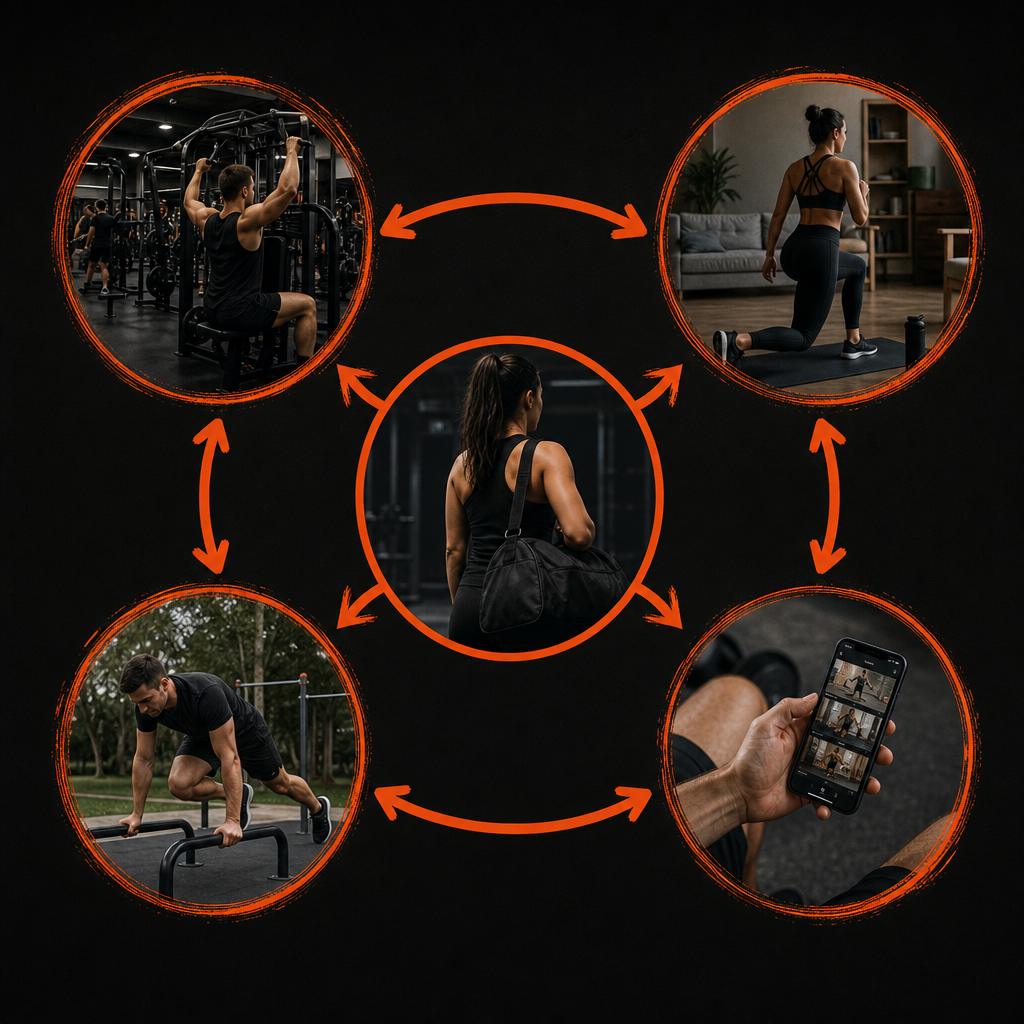
Consumers now move between facilities, outdoor activity, app-guided workouts and home sessions. This makes a gym membership an important indicator, but not a complete measure of exercise behaviour. The Australian Competition and Consumer Commission also reminds consumers that gym contracts are governed by ordinary consumer rights and that terms, cancellation conditions and recurring payments should be reviewed before joining (ACCC).
-
Worldwide inactivity rate: According to the World Health Organization's physical activity fact sheet (WHO), 31% of adults worldwide, or almost one-third, did not meet recommended activity levels in 2022.
-
Number of insufficiently active adults: According to the WHO (https://www.who.int/news-room/fact-sheets/detail/physical-activity), approximately 1.8 billion adults were insufficiently active in 2022.
-
Inactivity among women: According to the WHO (https://www.who.int/news-room/fact-sheets/detail/physical-activity), 34% of women worldwide were insufficiently active in 2022.
-
Inactivity among men: According to the WHO (https://www.who.int/news-room/fact-sheets/detail/physical-activity), 29% of men worldwide were insufficiently active in 2022.
-
Change since 2010: According to the WHO (https://www.who.int/news-room/fact-sheets/detail/physical-activity), adult physical inactivity increased by approximately 5 percentage points between 2010 and 2022.
-
Projected inactivity: According to the WHO (https://www.who.int/news-room/fact-sheets/detail/physical-activity), the global inactivity rate could reach 35% by 2030 if the current trajectory continues.
-
International reduction target: According to the WHO (https://www.who.int/news-room/fact-sheets/detail/physical-activity), countries adopted a target to achieve a 15% relative reduction in physical inactivity by 2030.
These global inactivity figures indicate the potential pool of people who could benefit from accessible exercise services. They do not show that all inactive people intend to join a gym. Cost, health, disability, transport, work schedules, caring responsibilities and personal preferences all affect participation.
Membership Demographics and Health Indicators
Australian gym demand sits within a population where inactivity and excess weight remain significant health issues. These indicators should be handled carefully. Body mass index is a population-level screening measure, not a diagnosis of an individual's fitness, health or training capacity.
-
Adults classified as overweight or obese: According to the ABS National Health Survey (ABS), 65.8% of Australian adults were overweight or obese in 2022.
-
Adult obesity prevalence: According to the ABS (https://www.abs.gov.au/statistics/health/health-conditions-and-risks/national-health-survey/latest-release), 31.7% of Australian adults were classified as obese in 2022.
-
Children above the healthy weight range: According to the ABS (https://www.abs.gov.au/statistics/health/health-conditions-and-risks/national-health-survey/latest-release), 26.4% of children aged 2-17 were overweight or obese in 2022.
-
Adults meeting the aerobic activity component: According to the ABS (https://www.abs.gov.au/statistics/health/health-conditions-and-risks/national-health-survey/latest-release), 46.9% of Australians aged 18-64 met the physical activity component of the guidelines in 2022.
-
Adults meeting the complete guidelines: According to the ABS (https://www.abs.gov.au/statistics/health/health-conditions-and-risks/national-health-survey/latest-release), only 22.4% of Australians aged 18-64 met both the physical activity and muscle-strengthening components in 2022.
-
Adults meeting the strength component: According to the ABS (https://www.abs.gov.au/statistics/health/health-conditions-and-risks/national-health-survey/latest-release), 27.0% of Australians aged 18-64 met the muscle-strengthening component in 2022.
Australian Physical Activity Benchmark Table
| ABS indicator | Australian result | Population and period | Source |
|---|---|---|---|
| Met physical activity component | 46.9% | Ages 18-64, 2022 | ABS National Health Survey |
| Met both activity and strength components | 22.4% | Ages 18-64, 2022 | ABS National Health Survey |
| Met muscle-strengthening component | 27.0% | Ages 18-64, 2022 | ABS National Health Survey |
| Adults overweight or obese | 65.8% | Adults, 2022 | ABS National Health Survey |
| Adults classified as obese | 31.7% | Adults, 2022 | ABS National Health Survey |
| Children overweight or obese | 26.4% | Ages 2-17, 2022 | ABS National Health Survey |
The gap between the 46.9% meeting the aerobic component and the 22.4% meeting both components matters for gym programming. It suggests that muscle-strengthening participation is a material constraint. Facilities serving general populations may need to make resistance training less intimidating, provide clear technique guidance and offer options for older adults and beginners.
Australian Market Statistics
Australian gym membership estimates vary because researchers use different minimum ages, definitions and survey methods. A person with a paid membership may not attend regularly, while a non-member may use casual passes, community facilities, workplace gyms or outdoor equipment.
-
Australian gym members: According to Roy Morgan's Australian consumer research (Roy Morgan), approximately 4.82 million Australians held a gym membership in 2018.
-
Membership penetration: According to Roy Morgan (https://www.roymorgan.com/), those members represented 28.2% of Australians aged 14 and over in 2018.
-
Earlier membership base: According to Roy Morgan (https://www.roymorgan.com/), approximately 3.8 million Australians held gym memberships in 2016.
-
Earlier penetration rate: According to Roy Morgan (https://www.roymorgan.com/), gym members represented approximately 24.9% of Australians aged 14 and over in 2016.
-
Fitness and gym participation ranking: According to Australian Sports Commission AusPlay results (AusPlay), fitness and gym activity has ranked as the second most popular participation activity among Australian adults, behind walking in relevant annual reporting.
-
Walking participation ranking: According to AusPlay (https://www.ausport.gov.au/clearinghouse/research/ausplay/results), walking has ranked as the most popular adult participation activity in Australia.
The Roy Morgan figures are historical and predate the pandemic. They remain useful as a baseline, but they should not be described as Australia's current 2026 membership count. For more focused interpretation of membership measures, see the separate Australian gym membership statistics reference.
Historical Australian Membership Comparison
| Metric | 2016 | 2018 | Source |
|---|---|---|---|
| Australians with gym memberships | 3.8 million | 4.82 million | Roy Morgan |
| Share of Australians aged 14 and over | 24.9% | 28.2% | Roy Morgan |
This table shows a historical change, not a continuous year-by-year series. It should not be extrapolated mechanically to 2026 because the pandemic, population growth, household finances and changes in fitness delivery affected the market after 2018.
Equipment Innovation and Training Technology
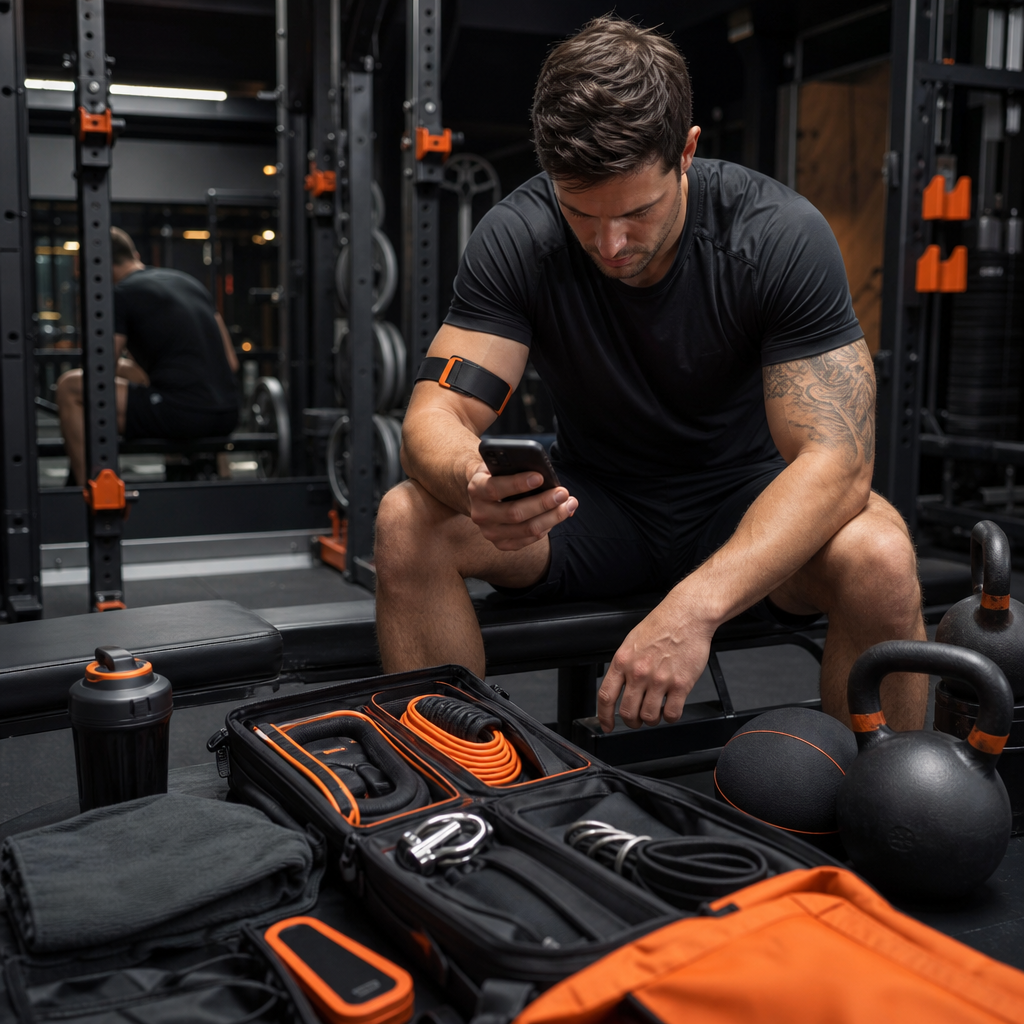
Technology is changing both large equipment and the small items used between sets. Wearables, apps and connected machines collect training data, while simpler products address storage, hygiene and access to personal items. Purpose-built equipment should solve a defined training problem rather than add unnecessary complexity.
-
Wearable technology: According to the American College of Sports Medicine's 2025 Worldwide Survey of Fitness Trends (ACSM), wearable technology ranked first among the surveyed fitness trends.
-
Mobile exercise apps: According to ACSM (https://www.acsm.org/), mobile exercise apps ranked second.
-
Fitness programs for older adults: According to ACSM (https://www.acsm.org/), fitness programs for older adults ranked third.
-
Exercise for weight loss: According to ACSM (https://www.acsm.org/), exercise for weight loss ranked fourth.
-
Traditional strength training: According to ACSM (https://www.acsm.org/), traditional strength training ranked fifth.
-
High-intensity interval training: According to ACSM (https://www.acsm.org/), high-intensity interval training ranked sixth.
-
Data-driven training technology: According to ACSM (https://www.acsm.org/), data-driven training technology ranked seventh.
-
Exercise for mental health: According to ACSM (https://www.acsm.org/), exercise for mental health ranked eighth.
-
Functional fitness training: According to ACSM (https://www.acsm.org/), functional fitness training ranked ninth.
-
Health and wellness coaching: According to ACSM (https://www.acsm.org/), health and wellness coaching ranked tenth.
ACSM Fitness Trend Rankings
| Rank | Fitness trend | Source |
|---|---|---|
| 1 | Wearable technology | ACSM |
| 2 | Mobile exercise apps | ACSM |
| 3 | Fitness programs for older adults | ACSM |
| 4 | Exercise for weight loss | ACSM |
| 5 | Traditional strength training | ACSM |
| 6 | High-intensity interval training | ACSM |
| 7 | Data-driven training technology | ACSM |
| 8 | Exercise for mental health | ACSM |
| 9 | Functional fitness training | ACSM |
| 10 | Health and wellness coaching | ACSM |
These rankings measure perceived trend importance among surveyed fitness professionals. They are not Australian sales shares. Their practical value is in showing how digital tracking, population ageing, strength work and health-oriented programming are shaping service and equipment decisions.
Boutique Fitness, Pilates and Recovery Demand
ClassPass booking data offer a view of behaviour on one international platform. They do not include the whole fitness market and should not be used as Australian participation rates. They can, however, reveal categories experiencing rapid booking growth.
-
Pilates category leadership: According to the ClassPass 2024 Look Back Report (ClassPass), Pilates was the platform's most-booked workout for the second consecutive year.
-
Pilates reservation growth: According to ClassPass (https://classpass.com/blog/2024-classpass-look-back-report/), Pilates reservations increased by 84% in 2024.
-
Sports recovery growth: According to ClassPass (https://classpass.com/blog/2024-classpass-look-back-report/), sports recovery reservations increased by 155% in 2024.
-
Low-impact training growth: According to ClassPass (https://classpass.com/blog/2024-classpass-look-back-report/), low-impact training reservations increased by 109% in 2024.
-
Dance booking growth: According to ClassPass (https://classpass.com/blog/2024-classpass-look-back-report/), dance reservations increased by 83% in 2024.
ClassPass Category Growth Table
| Category | Reported change in reservations | Period | Source |
|---|---|---|---|
| Pilates | 84% increase | 2024 | ClassPass 2024 Look Back Report |
| Sports recovery | 155% increase | 2024 | ClassPass 2024 Look Back Report |
| Low-impact training | 109% increase | 2024 | ClassPass 2024 Look Back Report |
| Dance | 83% increase | 2024 | ClassPass 2024 Look Back Report |
For Australian operators, the relevant question is whether local bookings, enquiries and retention data show a similar pattern. A global platform increase may reflect the platform's geographic mix, new studio supply, promotional activity or changes in its user base.
Proprietary Consumer Intent and Practical Equipment Signals
The final two observations come from HoldIT rather than an independent whole-of-market study. They are included because the content brief specifically supplied these figures. They should be treated as business-level signals, not national benchmarks.
-
Search demand for innovative gym gear: According to HoldIT consumer-intent data supplied for this report, search volume associated with innovative gym gear increased by 22% during the business's selected comparison period. The dataset's keyword list, exact dates and search platform were not supplied, so the result cannot be independently reproduced from the information available.
-
Recommended magnetic load: According to HoldIT's own product specification, its magnetic bag hook has a maximum recommended load of 4 kg. This is a product-level equipment specification rather than an industry average. HoldIT's business and product context is available from its supplied website reference.
Case Study: HoldIT Consumer Intent Data
The reported 22% increase suggests growing interest in gym products designed around practical training-floor problems. These can include keeping phones and keys within arm's reach, keeping bags off the floor and ensuring the bench stays clear between sets.
The signal should not be interpreted as proof that the entire Australian gym equipment market grew by 22%. Search-volume change can be affected by keyword selection, seasonality, advertising, media coverage and changes to the measurement platform. A robust follow-up analysis would disclose the comparison dates, search tool, geography, match type and complete keyword set, then compare search behaviour with sales and independent market data.
The product specification also illustrates an important distinction in equipment statistics. A rated or recommended load describes a product under stated conditions. It does not establish that every metal surface, installation angle or gym environment will produce identical performance. Equipment users should follow the manufacturer's instructions and keep walkways clear.
What Practitioners Should Do With This Data
Separate commercial and social-value measures
Do not add the approximately $3.5 billion industry revenue estimate to the $8.5 billion economic-benefit estimate. Industry revenue measures commercial activity. Economic-benefit modelling attempts to value wider effects such as healthcare savings and productivity.
Build local benchmarks before relying on global trends
The WHO, ACSM, Health & Fitness Association and ClassPass provide useful context, but none supplies a current Australian gym membership total for 2026. Australian operators should compare these signals with their own joins, cancellations, attendance frequency, class occupancy and revenue per member.
Track strength participation as a distinct metric
The ABS figures show a large difference between meeting the aerobic activity component and meeting both aerobic and strength recommendations. Gyms should separately monitor participation in resistance training, induction completion, programme adherence and confidence using free weights or machines.
Measure retention, not only acquisition
A rising membership count can hide weak attendance or high churn. Useful operating measures include active members, visits per member, reactivations, cancellations, membership freezes and the share of new members still attending after their initial joining period.
Test demand by demographic and activity type
Older-adult programming, strength training, Pilates, recovery and app-supported exercise appear prominently across the cited sources. Demand should still be verified by suburb, age group, facility type and price point before equipment or timetable decisions are made.
Treat small convenience problems as part of the member experience
Facility planning often focuses on large assets, but clutter, trip hazards, phone storage and access to personal items can interrupt training. Storage should keep equipment and personal gear off the floor without occupying benches or blocking circulation areas. The aim is straightforward: reduce friction so members can focus on training.
Methodology and Disclaimer
This article aggregates publicly available statistics from government agencies, international health bodies, market research organisations, industry associations, academic research and fitness platforms. Australian sources were prioritised where comparable data were available.
The 45 numbered observations include Australian market statistics, global contextual benchmarks, professional trend rankings and two figures supplied as HoldIT's own data. Global figures are clearly identified and must not be represented as Australian market shares. Proprietary figures are labelled so they are not confused with independent research.
Some sources update online industry pages without preserving every previous estimate. Paywalled market research may also expose only selected headline figures publicly. Readers using these statistics in financial, academic or editorial work should open the original source, confirm the release date and check whether a newer edition is available.
Percentages based on different populations cannot be compared without adjustment. For example, Roy Morgan's gym membership research covered Australians aged 14 and over, while ABS physical activity measures cited here cover adults aged 18-64. ClassPass reports platform reservations rather than population participation.
Statistics sourced from publicly available research and industry reports. Verify individual figures before publishing. This article does not provide medical, financial or investment advice.
Sources
- Australian Bureau of Statistics, "National Health Survey: First results, 2022": https://www.abs.gov.au/statistics/health/health-conditions-and-risks/national-health-survey/latest-release
- IBISWorld, "Gyms and Fitness Centres in Australia": https://www.ibisworld.com/australia/industry/gyms-fitness-centres/658/
- Australian Sports Commission, AusPlay results: https://www.ausport.gov.au/clearinghouse/research/ausplay/results
- AUSactive, Australian fitness industry research and resources: https://ausactive.org.au/
- Roy Morgan, Australian consumer and gym membership research: https://www.roymorgan.com/
- World Health Organization, "Physical activity": https://www.who.int/news-room/fact-sheets/detail/physical-activity
- Ding, D. et al., "The economic burden of physical inactivity: a global analysis of major non-communicable diseases", The Lancet: https://doi.org/10.1016/S0140-6736(16)30383-X
- Health & Fitness Association, global health and fitness industry research: https://www.healthandfitness.org/
- American College of Sports Medicine, Worldwide Survey of Fitness Trends: https://www.acsm.org/
- ClassPass, "2024 ClassPass Look Back Report": https://classpass.com/blog/2024-classpass-look-back-report/
- Australian Competition and Consumer Commission, consumer contract guidance: https://www.accc.gov.au/consumers/buying-products-and-services/contracts
- Australian Institute of Health and Welfare, "Insufficient physical activity": https://www.aihw.gov.au/reports/risk-factors/insufficient-physical-activity/contents/insufficient-physical-activity
- HoldIT, proprietary consumer-intent data and product specification supplied for this report: https://holditbag.store/https://holditbag.store/
FAQ_SCHEMA_JSON
Get exclusive training tips & early access
Join 5,000+ athletes who train smarter.
Frequently Asked Questions
How large is the Australian gym market in 2026?
IBISWorld industry research cited in this report places annual revenue for Australian gyms and fitness centres at approximately $3.5 billion. This is an industry revenue estimate, not a measure of all Australian spending on sport, equipment, apps or wellness services.
How many Australians have a gym membership?
Roy Morgan reported approximately 4.82 million Australian gym members in 2018, equal to 28.2% of Australians aged 14 and over. It is a historical benchmark and should not be described as a confirmed 2026 membership count.
Is the Australian gym industry growing?
Historical membership research, current multibillion-dollar revenue estimates and rising demand across strength, Pilates, recovery and fitness technology all indicate a sizeable market. Exact current growth rates depend on the source, period and industry definition.
What are the leading fitness equipment and technology trends?
The ACSM 2025 survey ranked wearable technology first, mobile exercise apps second and fitness programs for older adults third. Traditional strength training ranked fifth and data-driven training technology ranked seventh.
What percentage of Australian adults meet physical activity guidelines?
The ABS reported that 46.9% of Australians aged 18-64 met the physical activity component in 2022, while only 22.4% met both the activity and muscle-strengthening components.
Why do gym membership estimates differ between sources?
Estimates differ because surveys use different age ranges, definitions and methods. Some count paid memberships, while others measure participation, attendance or facility use. A member can also hold more than one membership.
Can global fitness statistics be used as Australian benchmarks?
Global figures can provide context and identify emerging categories, but they should not be presented as Australian market shares. Local population, pricing, facility supply and consumer behaviour must be considered.
Related Articles
Australian Health and Fitness Trends: 2026 Statistics Report
The Ultimate Guide to Gym Accessories in Australia: Elevate Your Workout
The Best Gym Bag for Functional Fitness and CrossFit in Australia
Your gear deserves better
Keep it clean, organised, and always within reach. The HoldIt bag system is built for athletes who take training seriously.